This project is open source, view it on GitHub.
During the corona pandemic I took up brewing beer as a new hobby – and judging by the increase in online activity on the subject, I wasn’t the only one. The process of brewing beer is composed of a lot of different steps, one of which is fermentation. During the fermentation process, yeast converts sugars into alcohol, creating the gold liquid we all love. The process can take anywhere between 2-4 weeks, and during that time the soon-to-be-beer (called wort) needs to be kept at a stable temperature.
I live in an apartment that is already quite full with desks and sports equipment due to a full year of working (out) from home. Unable to convince my SO to give up their desk, I had to resort to fermenting in the basement, five floors down. The basement, however, has no internet connection or WiFi. This meant I had to walk five floors down to check on the fermentation progress and couldn’t easily chart my metrics. Of course, being a data engineer, this was unacceptable.
The fermentation fridge
I bought a cheap secondhand fridge off of Marktplaats (Dutch version of craigslist) and had it delivered to me using Brenger (think Uber for goods). Because beer fermentation temperatures can range from 2°C to 35°C, a custom controller is needed to control both the fridge and a heating element. There are ready-made devices for this, like the Inkbird, but where’s the fun in that? Lucky for me, it turns out there’s quite some overlap between the home brewing and electronics communities and as such, there’s more than enough information to be found online on building your own controller. I ended up doing just that using an ESP8266, two relays, two temperature sensors and BrewPiLess firmware.
Specifically, I used the following components:
- Wemos D1 Mini
- Two waterproof DS18B20 temperature sensors
- Two 230V 10A relays with a 5V trigger
- Two power strips to plug the fridge and heating element into – so I could still use the fridge normally by plugging it into a regular outlet instead of the BrewPiLess-controlled strip
For a total cost of ~10 euros.
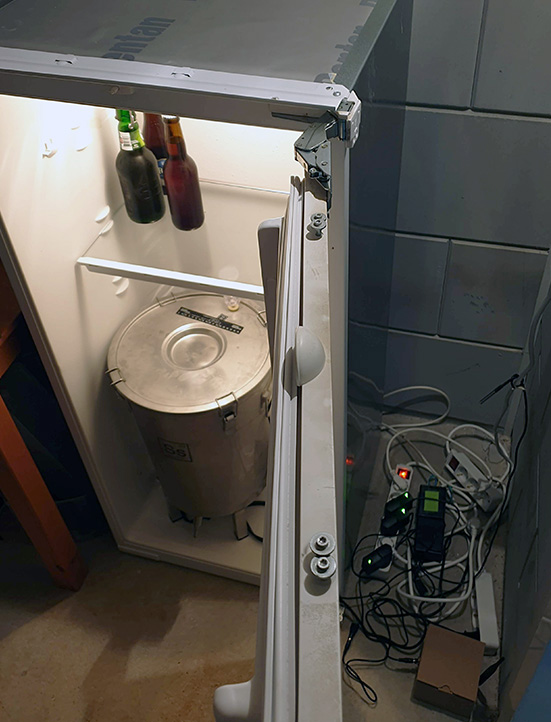 Don't mind the cable mess 🙈
The BrewPiLess firmware includes a PID controller for temperature, which can accurately control the fridge and heating element based on the beer, fridge and room temperatures. BrewPiLess works independently of an internet connection, and can act as a WiFi access point for other devices to connect to.
iSpindel
In the fermentation vessel I put an iSpindel, a device that registers temperature and specific gravity. Specific gravity correlates to the amount of sugar in the wort, which indicates how fermentation is progressing. The iSpindel device consists of another ESP8266 which connects to the BrewPiLess ESP via WiFi, reporting its metrics over HTTP.
LoRa
Like I mentioned in the intro, I really didn’t feel like walking down five floors everytime I wanted to check the fermentation status. I needed some way of getting the sensor data into a dashboard that I could conveniently access from anywhere. I did some research and learned about LoRaWAN, a network designed for IoT devices which fit my use case perfectly. As an added bonus, one of the mobile telecom providers in the Netherlands (KPN) exploits a LoRaWAN network that has country-wide coverage and is free to use for up to six devices. The only downside of LoRaWAN is that it only allows you to send a 20-byte message every 2 minutes – more on that later.
To get started I bought the following components:
- LoPy4 [€38.45] – this is easily the most expensive development board I’ve ever bought, but the convenience of having both LoRa and WiFi radios onboard plus being able to code in MicroPython was worth it for me
- 868MHz antenna from AliExpress [€2.37]
I used an FTDI232 serial to USB converter to upload firmware to the LoPy4.
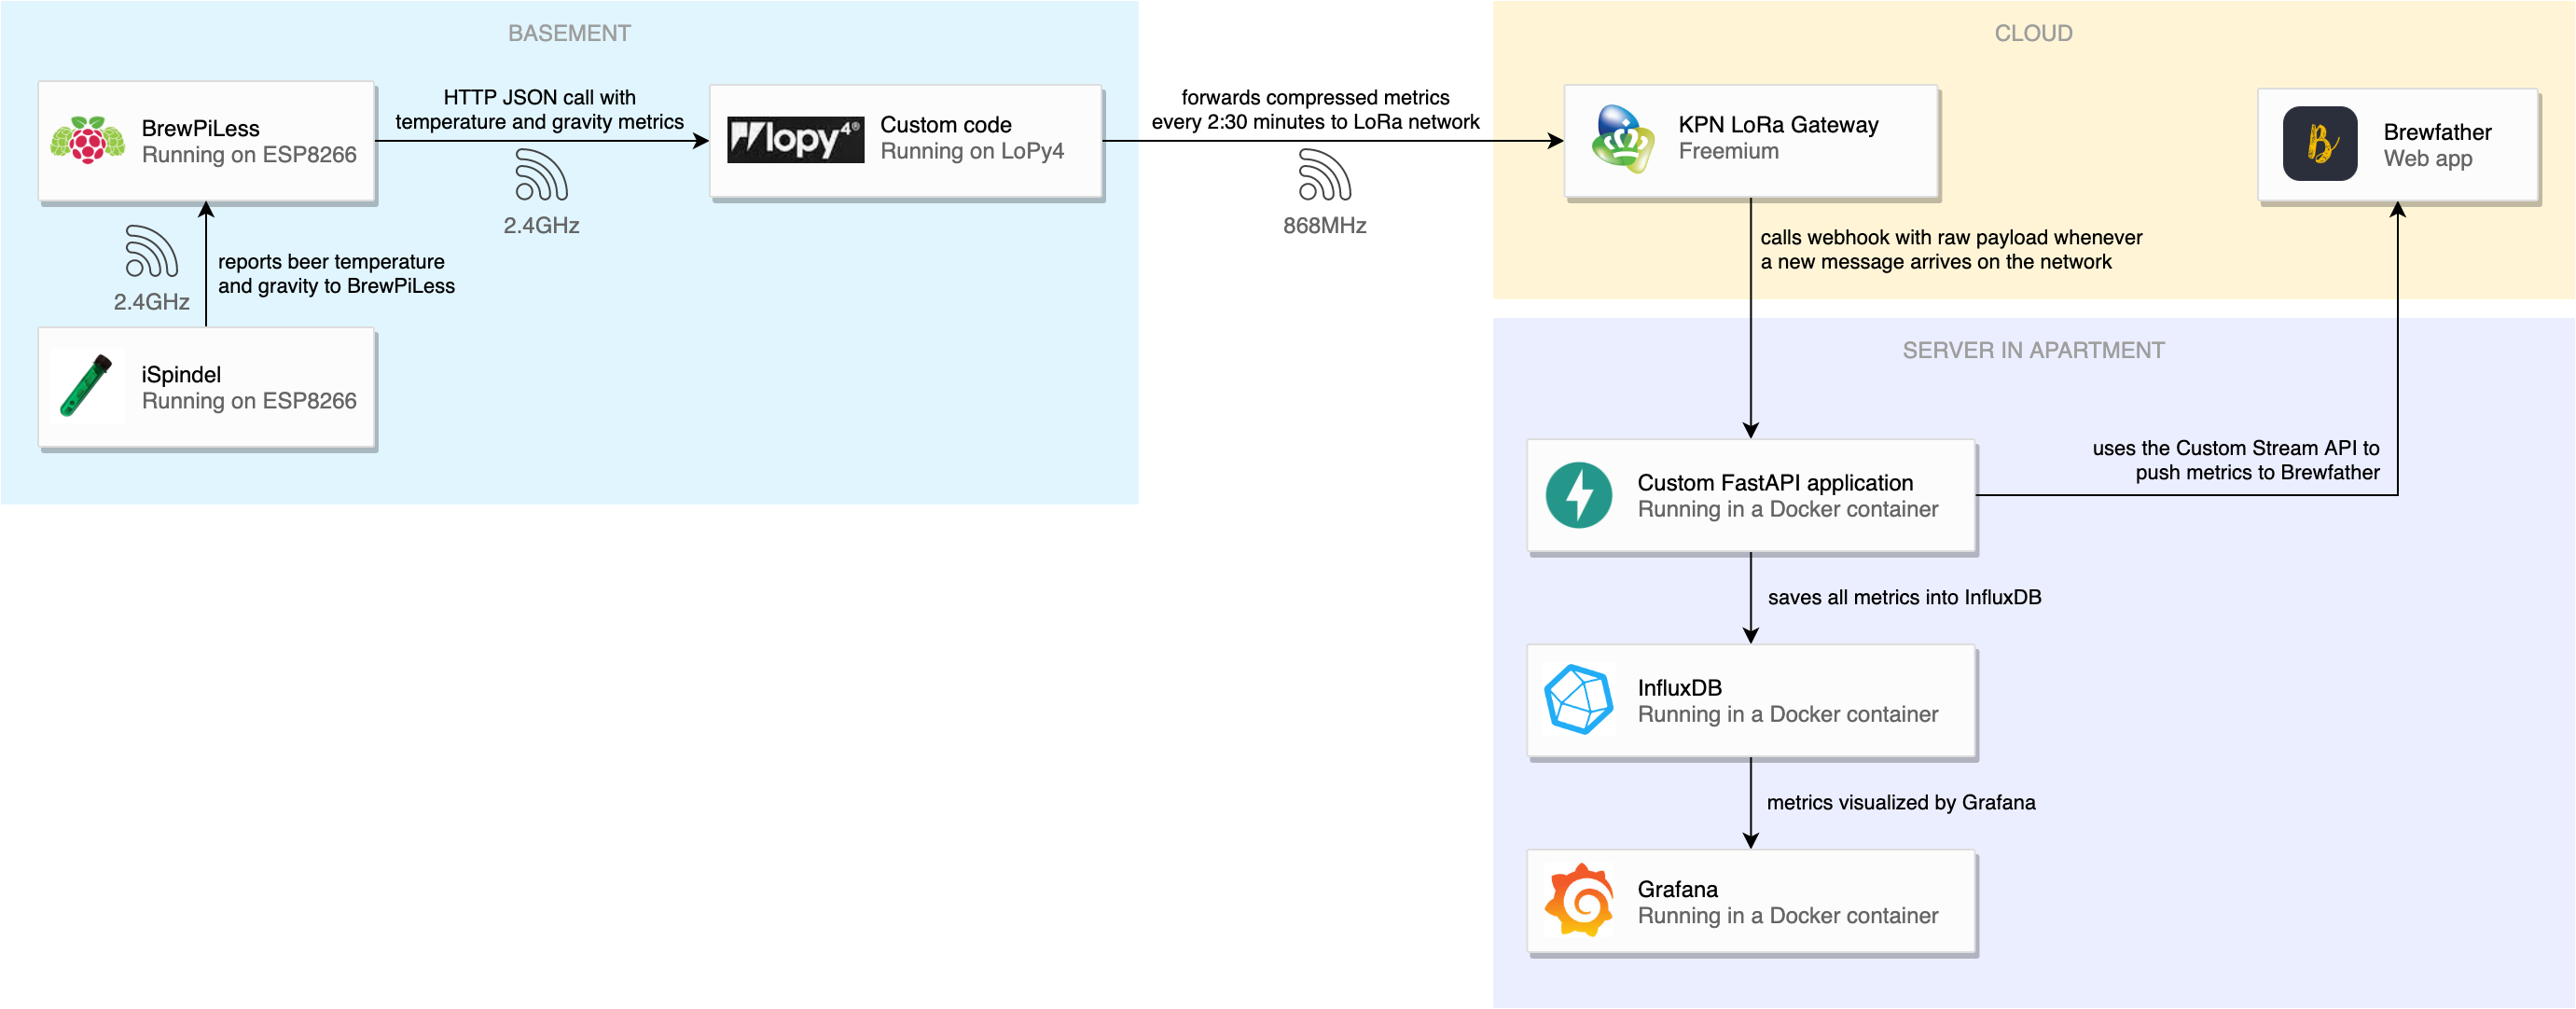
BrewPiLess has a remote logging feature which sends all of its metrics – temperature, specific gravity, cooling state, etc. – to an external HTTP endpoint. I use this feature to send metrics to a MicroWebSrv2 web server running on the LoPy4 device. The LoPy4 in turn forwards these metrics to KPN via the LoRa network. By configuring a webhook on the KPN Portal, all data is forwarded to my local web server, which in turn inserts the metrics into InfluxDB and forwards them to Brewfather. Quite some moving parts, but it turns out to work amazingly well and is actually really reliable.
LoRa air time restrictions
I previously mentioned how LoRaWAN only allows sending a 20-byte message every two minutes. In reality it’s actually a bit more complex. LoRa doesn’t restrict the amount of bytes you send or receive, but the time you are on air, i.e. the time the LoRa radio is actually active. The air time is dependent on quite some parameters, most notably the number of bytes in a message and the spreading factor. I won’t go into all the details, but the spreading factor basically governs the speed of data transmission. The higher the spreading factor, the lower the speed of data transmission, but the higher the processing gain at the receiver’s end. So it’s a tradeoff between speed and range. Because my basement is really just a giant block of concrete in the ground, I had to use the highest spreading factor (12) – and even then, roughly 10% of the messages don’t arrive at the LoRa gateway.
Using the maximum spreading factor, and keeping all other LoRa parameters at their defaults, we can calculate how often we are allowed to send messages as a function of their size. For example, it takes roughly 2.5 seconds to send a 51-byte message. Taking into account the maximum duty cycle of 1%, we have to wait 250 seconds before sending the next message. So there’s a tradeoff between the amount of information you send in a message and the temporal resolution.
I wanted to send the following metrics over LoRaWAN:
- Beer temperature
- Beer temperature setting
- Fridge temperature
- Fridge temperature setting
- Room temperature
- Auxiliary temperature (raw iSpindel temperature sensor output)
- Specific gravity (reported by iSpindel)
- Tilt (reported by iSpindel)
- Battery level of iSpindel
- Unit of temperature (°C or °F)
- Current controller setting (constant fridge, constant beer or beer profile)
- Current controller activity (idle, heating, cooling, et cetera)
The first 9 are all floats, while the last three are categorical. If we were to naively pack this in a byte string, this would be 4 bytes per float (36 bytes) plus one byte per categorical for a total of 39 bytes. Using the LoRa air time calculator this ends up allowing up to one data point per 3:17 minutes.
More efficient packing
A 32-bit float gives 6 to 9 significant decimal digits of precision, far greater than the precision of my sensors. Losing some precision here would not really be an issue, as long as I could get 3 to 4 significant decimal digits for most metrics (e.g. 20.1°C for temperature, or 1.012 for specific gravity).
I decided to cut precision in two and represent the floats as 2-byte signed short integers. I did this by simply scaling values with the maximum possible value of a metric (e.g. 100 for temperature in °C) and the maximum signed integer value. So in equation form:
integer_value = round(float_value * (2^15 / maximum_expected_value))
An example for a temperature of 20.1°C:
integer_value = round(20.1 * (2^15 / 100)) = 6586
This value can be represented in two little-endian bytes as:
0xba 0x19
Converting it back is as easy as reversing the equation above:
float_value = 6586 / (2^15 / 100) = 20.09949...
which is close enough for my use case.
Applying this on all floats (with different maximum_expected_value per unit) reduced the size to 18 bytes.
The three categoricals can also be compressed into a single byte using some bitshift magic.
In the end I wrote this Python function to compress all metrics:
    def marshal_metrics(metrics):
        # Define maximum values per metric
        factor_dict = [
            ("b", 300),
            ("B", 300),
            ("f", 300),
            ("F", 300),
            ("r", 300),
            ("g", 10000),
            ("t", 150),
            ("a", 300),
            ("v", 3000),
        ]
        msg = b""

        # Scale each metric and convert to signed short
        for key, factor in factor_dict:
            encoded = struct.pack("<h", int(metrics[key] * factor))
            msg += encoded

        # Construct a single byte from the three remaining categoricals
        msg += struct.pack(
            "<B",
            (int(metrics["U"] == "C") << 6)
            | (int(metrics["m"]) << 4)
            | int(metrics["s"]),
        )

        return msg
Without losing any significant precision this gives us a total message size of 19 bytes, shaving off a minute of the idle part of the duty cycle for a total of one data point per 2:12 minutes.
Dashboarding
I’m using both Brewfather and Grafana to visualize the metrics. Brewfather is a specialized application for homebrewing, and allows you to send custom metrics using their API. You end up with graphs like this:
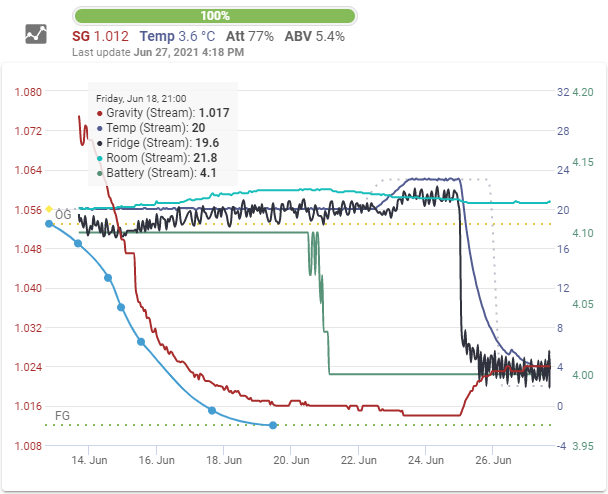
The dark blue graph is the beer temperature, and as you can see, it’s incredibly stable, which is the most important thing when fermenting beer. Note that the red graph (iSpindel gravity) is very dependent on temperature and because of this, isn’t very accurate in absolute terms. In the future I will have to look into mitigating this effect to increase accuracy. Still, the iSpindel fulfilled its primary function: showing me when fermentation is finished (i.e. when the gravity is not decreasing anymore).
Brewfather’s graphing capabilities are informative, but not very comprehensive. For example, there’s no zoom, the maximum temporal resolution is 15 minutes and there’s no way of showing the PID controller state (i.e. cooling, heating, idle). So I decided to also send all metrics to an InfluxDB instance and chart the metrics using Grafana (both of which I already had running).
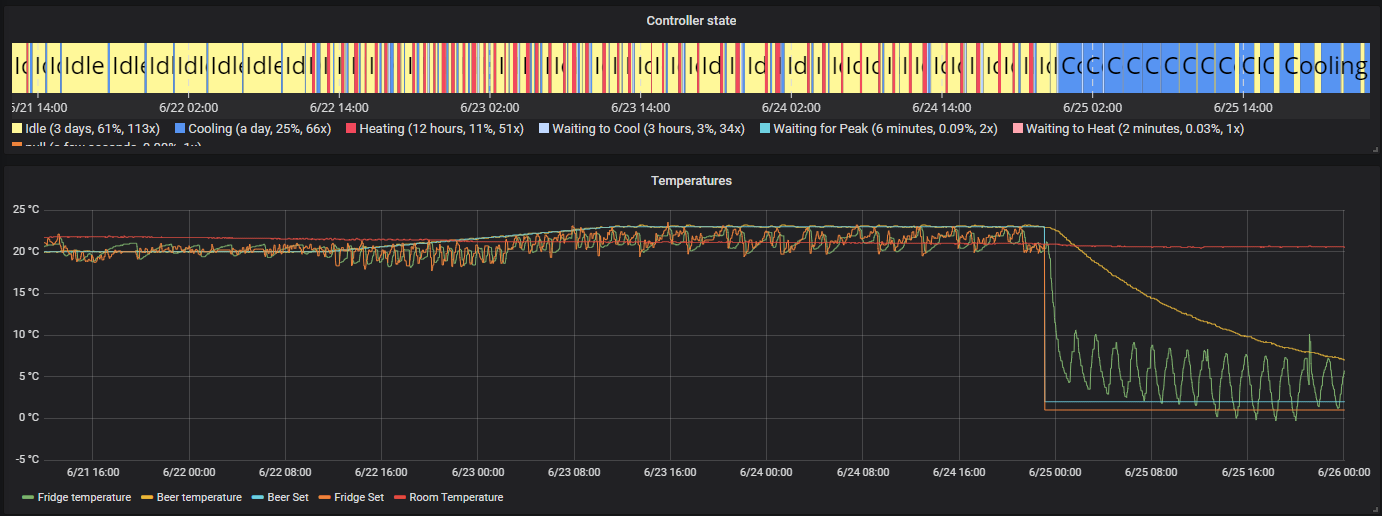
If you look closely at the controller state there is quite some PID overshoot happening when the set temperature is ramping up (roughly at 6/22 14:00). The controller is constantly cooling directly after heating. Charting this in Grafana gave me a lot more insight into the behaviour of the PID controller and will allow me to optimize it further by tuning the PID parameters, sensor positions and heat element intensity.
The result
 My first homebrew, the Artemis Ale “Cascade Pale Ale”
I really liked being able to combine electronics, IoT, data visualization and homebrewing into one project. My first brew was delicious and the next brew day is already planned. Have any suggestions? Hit me up! Want to view the code and use it yourself? Refer to the GitHub repository.